
The same track can feel powerful at one volume and weak at another, and your own hearing is the reason behind it.
Fletcher Munson Curve: What It Is and How to Use It
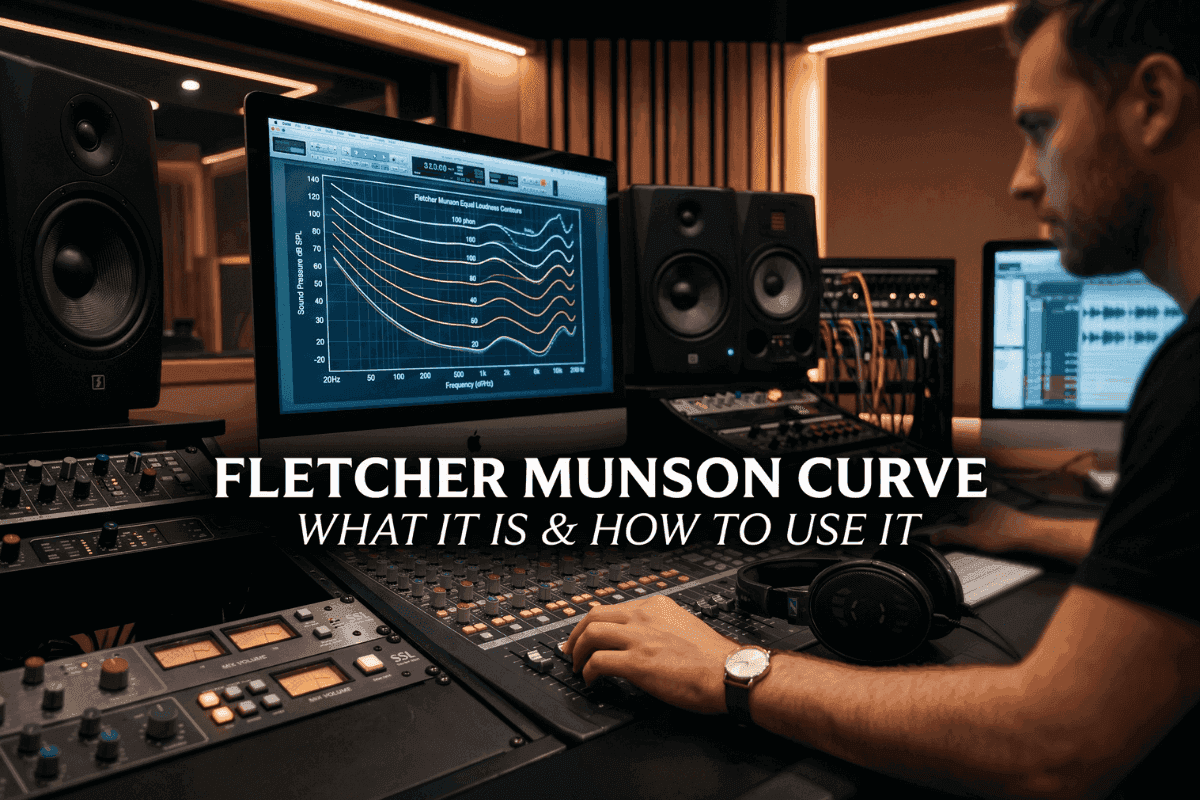
Have you ever noticed that a song sounds full and rich when you turn it up, then a little thin and hollow when you turn it down? You are not imagining it, and your speakers are not to blame. The difference comes down to the way human hearing works, and it has a name.
The Fletcher-Munson curve explains why the same track can sound so different at different volumes. Once you understand it, a lot of confusing moments in mixing and mastering start to make sense. Here is what the curve is, the mistakes it tends to cause, and how engineers work around it every day.
What the Fletcher-Munson Curve Actually Is
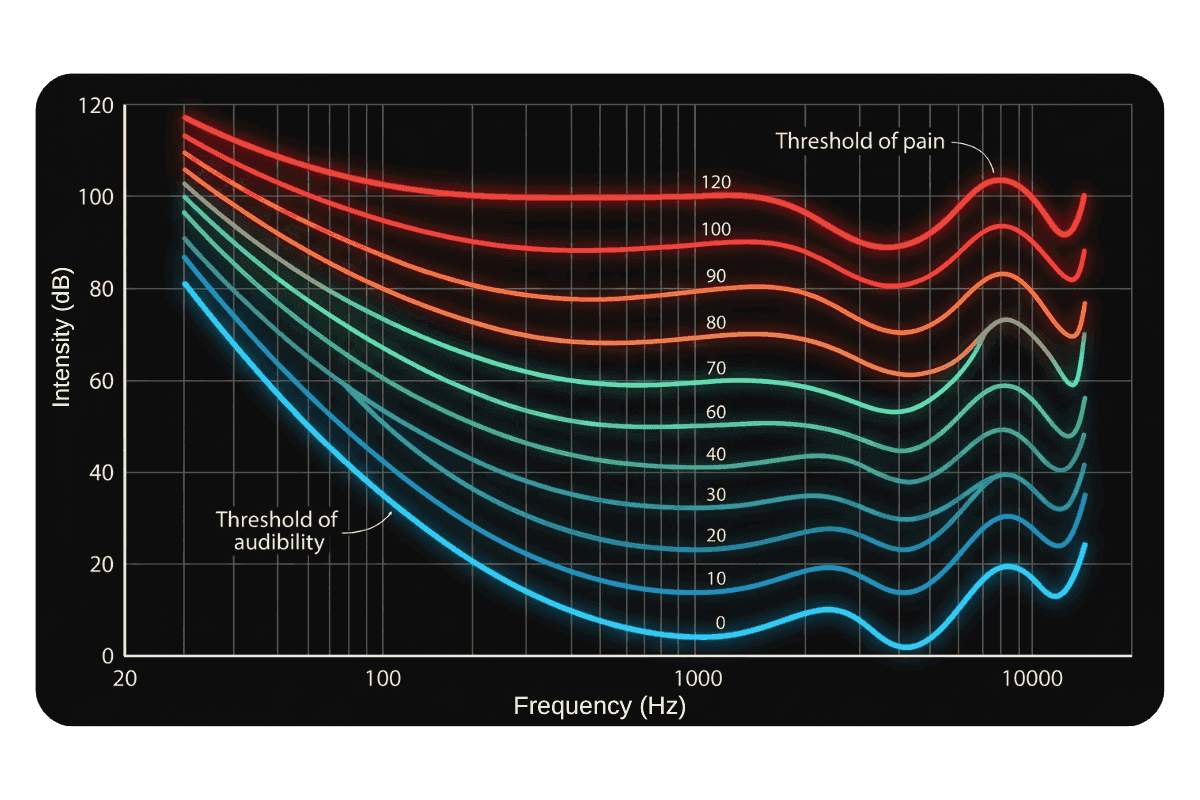
Back in 1933, two researchers named Harvey Fletcher and Wilden Munson measured how loud different frequencies need to be before they sound equally loud to us. Their work produced a set of equal loudness contours, now commonly called the Fletcher-Munson curves.
The finding was simple. Human hearing is not equally sensitive across all frequencies. We are most sensitive in the midrange, roughly between 2 and 5 kHz. Bass notes and very high frequencies need more energy before they sound as loud as those mids do.
These curves are measured in a unit called phons, which tracks perceived loudness rather than raw output. At quiet listening levels, the midrange dominates while the lows and the extreme highs sink into the background. Raise the volume and the balance starts to even out.
The key takeaway is that the audio signal never changes. Your perception of it does. That single fact sits behind a surprising number of mixing and mastering decisions that quietly go wrong.
The Translation Traps It Creates
Because your ears downplay certain frequencies at low volume, you start making choices to compensate. Many of them backfire once the track is played somewhere else.
Bass is the classic trap. When you monitor quietly, the low end sounds thin, so you push it up. Played loud later, that same mix turns muddy and boomy with an overpowering bottom.
High frequencies cause similar trouble. They can seem to disappear at low levels, which tempts you into adding brightness. The result is often harsh cymbals and a fatiguing top end once the volume rises.
Mids behave the other way around. They sit forward when things are quiet, so you might scoop them out and weaken your vocals without realizing it. Together, these habits are a major reason a mix struggles to hold up across monitors, headphones, car speakers, and phones. A great mix is not tuned for one volume. It survives many.
Three Myths Worth Unlearning
A few misunderstandings about this curve get repeated constantly. Clearing them up will save you a lot of confusion.
Myth: It tells you to mix at low volumes.
It does not. The curve only explains that your perception changes with level. The real lesson is to check your mix at several volumes, rather than keeping everything quiet.
Myth: It is a fixed, unchangeable line.
There is no single line. The curve is really a family of contours, one for each loudness level. The shape changes depending on how loudly you listen.
Myth: Fletcher and Munson's data is still the absolute standard.
Their 1933 research was groundbreaking, but it has since been refined and updated. The modern reference is the ISO 226 standard, which the next sections will touch on.
What Volume Should You Mix At
This is one of the most searched questions on the topic, and there is a sensible answer. A common recommendation is to monitor around 55 to 65 dB SPL, roughly the level of a normal conversation. Treat that as a starting point rather than a strict rule.
Going much louder is tempting but risky. It tires your ears quickly and distorts your judgment, so choices made loud often look poor the next day. Going too quiet hides important detail and pushes you straight back into the bass trap.
From there, experienced engineers rely on a few simple habits. They check the mix quiet, at a normal level, and loud. They compare against reference tracks from professional releases. They test on several systems, and they take breaks, because perception drifts as ears get tired.
The Modern Reality: ISO 226 and Streaming
The original Fletcher-Munson research was foundational, but it was not the last word. The contours were refined over the decades and now live in an international standard called ISO 226, updated most recently in 2023. The newer data is more accurate, especially in the low-frequency region.
Streaming changed the picture too. Platforms normalize playback loudness so tracks sit at a consistent level. Spotify normalizes to around -14 LUFS, and Apple Music sits near -16 LUFS. This matters, but it is easy to misread. Normalization makes playback levels more consistent, yet it does nothing to change the way your hearing shifts with volume. The curve still applies on every device.
Why Translation Matters During Mastering
All of this points to one goal. A strong master should hold together when it is quiet, stay solid when it is loud, and travel well across very different playback systems. That consistency is what separates a track that sounds professional everywhere from one that only works on the speakers it was made on.
Remasterify is built to support that final stage, with a clear focus on helping your music translate. Phones, laptops, earbuds, car stereos, and large speakers all reproduce sound differently. On top of that, each streaming service plays your track back at its own loudness. A master that ignores all this can feel great in one place and fall flat in another.
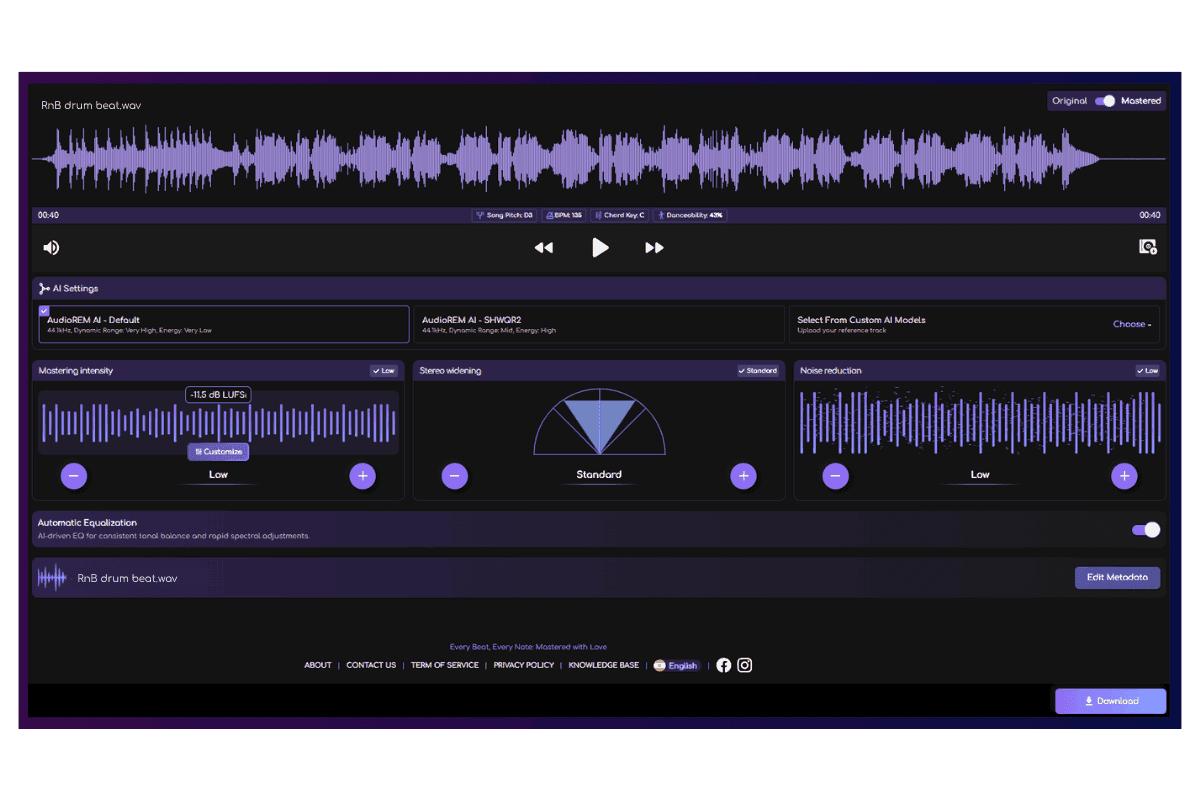
Its loudness normalization helps your track sit at sensible levels for streaming, so platforms like Spotify and Apple Music adjust your playback as little as possible. That keeps your loudness and overall balance closer to what you intended, wherever the track is heard. Its mastering intensity controls then let you decide how much processing to apply. That helps you settle on a natural, even sound that holds up across systems, instead of one tuned for a single set of speakers. Think of it as a quality-control layer for your finished master, rather than a way to repair mixing choices made earlier on.
Your 5-Step Fletcher-Munson Workflow
You can put all of this into practice today with a short routine.
- Start at a comfortable monitoring level, around conversation volume.
- Check your mix quietly to hear what holds up and what disappears.
- Turn it up and listen again before making any EQ moves.
- Compare your track against a professional reference in the same genre.
- Test on several systems — headphones, a car, and a phone — before you export.
If your track works at every one of these stages, it is far more likely to translate everywhere your listeners hear it.
Frequently Asked Questions
What is the Fletcher-Munson curve?
It is a set of equal loudness contours that show how sensitive our ears are to different frequencies at different volumes. The idea comes from 1933 research by Harvey Fletcher and Wilden Munson. The curves are measured in phons, a unit that reflects perceived loudness rather than raw output.
What is the point of the Fletcher-Munson diagram?
The diagram shows that human hearing is not equally sensitive across all frequencies. Its main purpose is to explain why the same track can sound different at different volumes. For producers and engineers, it is a reminder to monitor carefully and check mixes at more than one level.
How do you read a Fletcher-Munson curve?
The horizontal axis shows frequency in Hz, and the vertical axis shows sound pressure level in dB. Each curved line represents one constant level of perceived loudness, measured in phons. Where a line dips lower, your ears are more sensitive, and where it rises, they are less sensitive.
How do you mix with the Fletcher-Munson curve?
You do not apply it as an EQ setting. Instead, mix at a moderate, consistent level, then check your decisions at both quieter and louder volumes. Be careful with bass, and compare your track against professional references to keep your balance honest.
Can a human hear 21,000 Hz?
For almost everyone, no. Human hearing usually runs from about 20 Hz to 20,000 Hz, and 21,000 Hz sits just beyond that upper edge. Some young people may detect sounds slightly above 20,000 Hz, but that limit drops as we age.